
Inland Empire Media Ecosystem Assessment
Created for the launch of the Inland Empire Journalism Innovation Hub + Fund, this Map of media outlets and stations in the Inland Region clusters local news by type, service area and ethnicity.

Created for the launch of the Inland Empire Journalism Innovation Hub + Fund, this Map of media outlets and stations in the Inland Region clusters local news by type, service area and ethnicity.

A report combining data visualization and narrative storytelling humanizing the impactful work of the Black Equity Fund in the Inland Empire to understand where the black community is excelling and where need exists
Black residents are leading a momentum of change through a continuing legacy of civic engagement and high voter turnout across the Inland Empire. This resilience is even more exceptional in the face of the disproportionate impacts of the justice system on the regions Black communities.
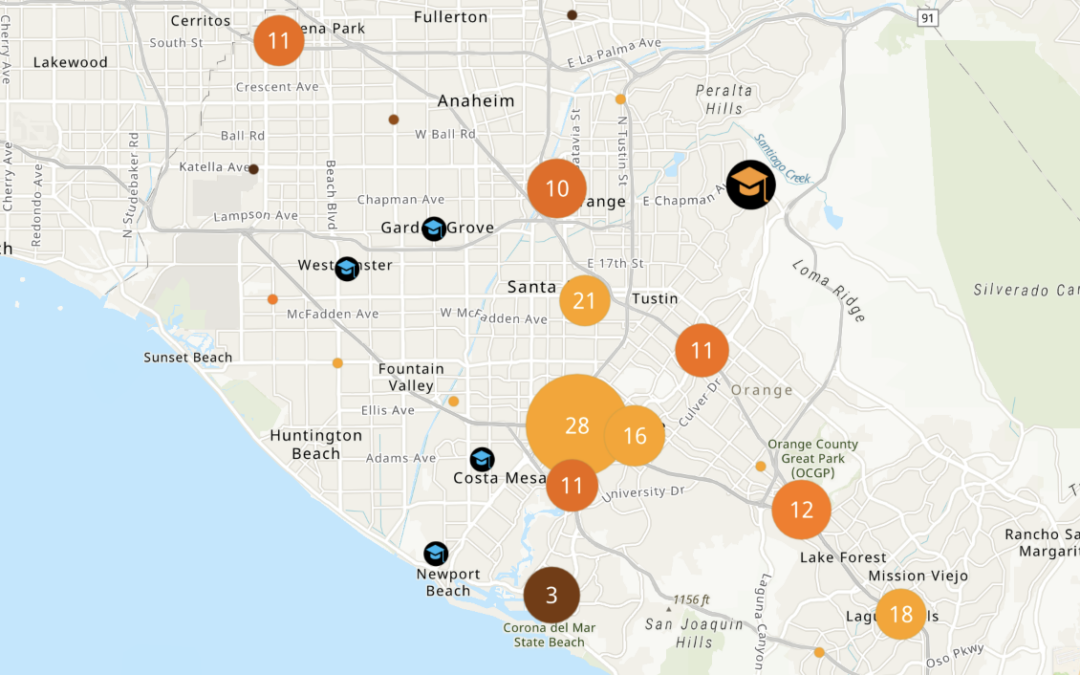
Facilitating the job search for Santiago Canyon College’s students as they transition out of the
school’s presitigous real estate program and into the workforce by displaying the areas with the
highest concentration of employment opportunities.

Maps on disinvested communities, equity inclusiveness, COVID recovery, and sustainability/environmental justice grounded the region’s planning process in data helping to ensure equitable decison making.

Join our mailing list to receive the latest news and updates from our team.

Be among the first to know what MBC has going on. Subscribe to our newsletter to stay in the loop.
Recent Comments