
Projects
Data is our thing. Researching, gathering, visualizing, and analyzing data is what we do.
We develop Mapping Black California branded flagship projects, conduct research and create datajournalism visualizations for our parent organization, Black Voice News, and externally collaborate with consultants on a variety of projects ranging from civic media campaigns to philanthropic analysis and much more.
MBC Flagship

Created for the launch of the Inland Empire Journalism Innovation Hub + Fund, this Map of media outlets and stations in the Inland Region clusters local news by type, service area and ethnicity.

The Combating Racism as a Public Health Crisis platform leverages burgeoning web recorder screen capture technology to centralize California declarations as a resource and accountability tool for the state’s elected officials and community members.
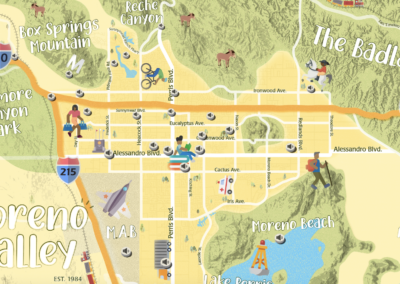
Moreno Valley is a vital, yet overlooked, part of the narrative on Black migration to the Inland Empire. Through oral histories collected from past and present Black residents, The Blackest City captures the experiences and stories of building a family, practicing religion, making a living, building community, engaging in sports and leisure activities, and raising the young in Moreno Valley. These stories were geographically pinned on a map, offering a tangible representation of the community's history affirming the communities vision for a thriving and inclusive
community in the Inland Empire’s Blackest City.
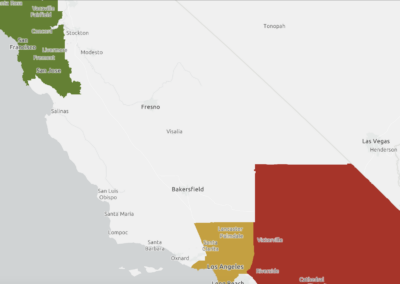
This map and StoryMap combines data visualization and narrative storytelling humanizing the impactful work of the Black Equity Fund in the Inland Empire.
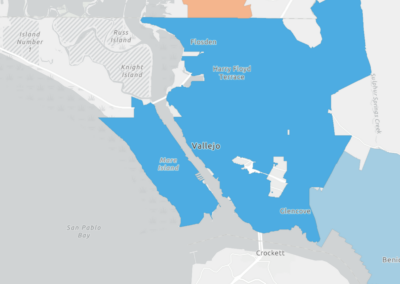
This study analyzes the variability of police spending in 476 California cities from 2014 to 2019, visually representing the percentage of municipal budgets allocated to police departments and contracts with county sheriff departments. The research highlights significant differences in police spending across the state and investigates the relationships between spending
percentages and population changes during the 5-year period.

California’s Only Comprehensive Statewide Database of Black-Led Organizations. An intersectional digital resource.
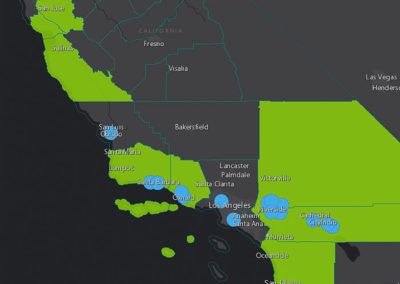
The Racism as a Public Health Crisis Dashboard
provides a view of what is changing/or has
changed across California municipalities
regarding county and city declarations.
MBC Consulting
Created for the launch of the Inland Empire Journalism Innovation Hub + Fund, this Map of media outlets and stations in the Inland Region clusters local news by type, service area and ethnicity.
A report combining data visualization and narrative storytelling humanizing the impactful work of the Black Equity Fund in the Inland Empire to understand where the black community is excelling and where need exists
Black residents are leading a momentum of change through a continuing legacy of civic engagement and high voter turnout across the Inland Empire. This resilience is even more exceptional in the face of the disproportionate impacts of the justice system on the regions Black communities.
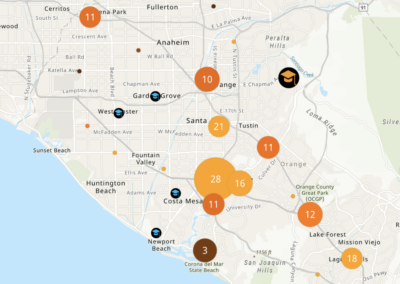
Facilitating the job search for Santiago Canyon College's students as they transition out of the
school's presitigous real estate program and into the workforce by displaying the areas with the
highest concentration of employment opportunities.
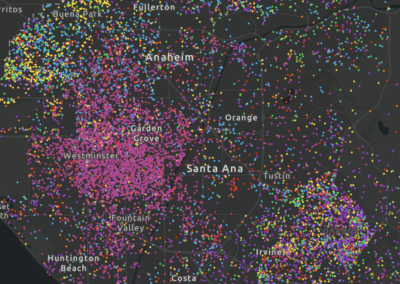
Maps on disinvested communities, equity inclusiveness, COVID recovery, and sustainability/environmental justice grounded the region's planning process in data helping to ensure equitable decison making.
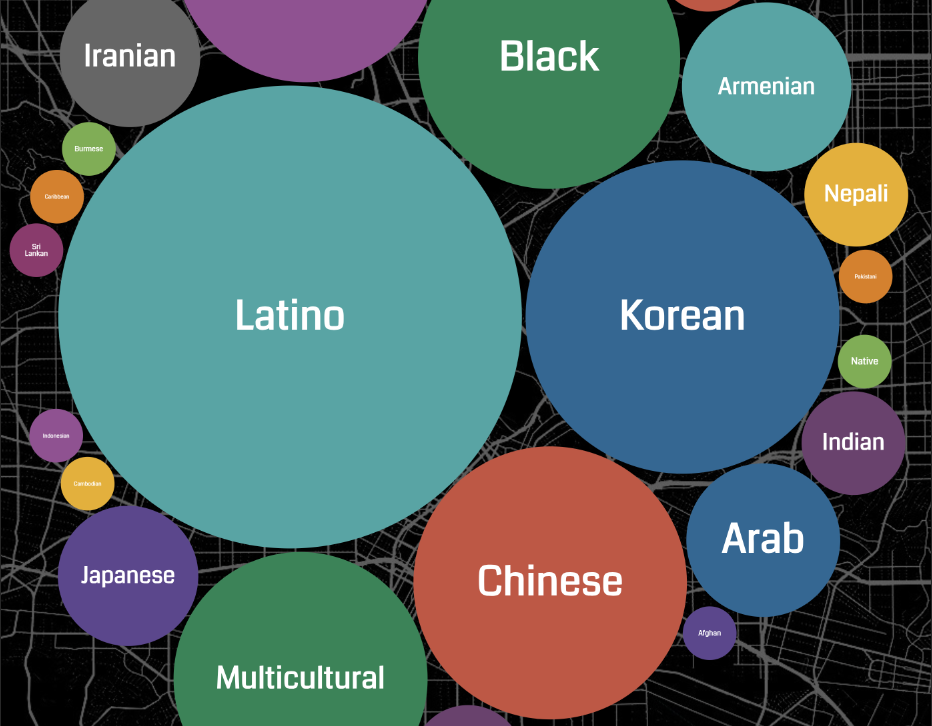
MBC designed and developed a data visualization of news ecosystems in Los Angeles County as a means to identify reach and gaps in information dissemination to socioeconomically and racially diverse Los Angeles County residents.
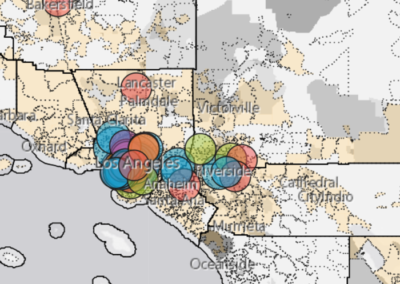
Mapping Black California developed a map visualizing Black Led Organization (BLO) giving patterns in Southern California Gas Company (SoCalGas) territories from 2019 - 2020.
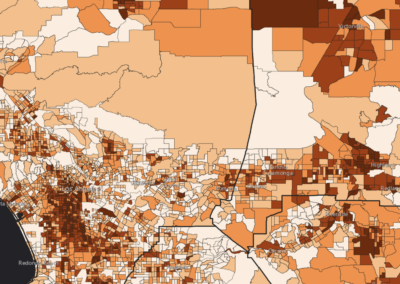
A collaborative effort with Black media to statewide working collective on Census 2020 reporting and community engagement for a complete count.
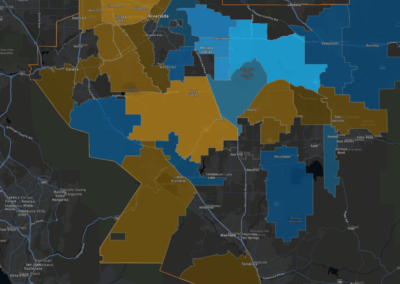
An easy to use guide to help identify vaccination rates for densely
populated Black and Latino areas in Riverside County.
MBC Newsroom
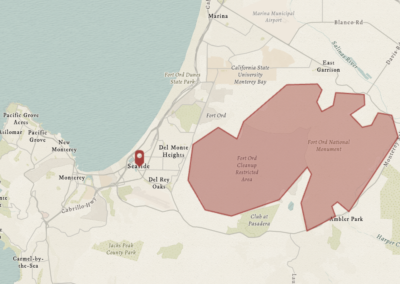
Despite civil rights laws, informal discrimination and economic barriers restricted their access. Specific cases like the Pacific Beach Club and Bruce's Beach illustrate the resistance and discrimination Black beachgoers encountered. However, recent efforts have led to the return
of Bruce's Beach to its rightful owners."
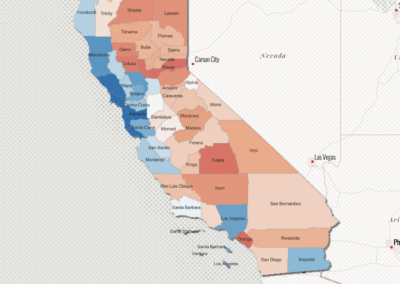
Over the past decade, California has experienced a growing Democratic trend in presidential elections, indicated by an increasing ratio of votes for Democrats compared to Republicans,as the state's diverse population, including Black, Latino, and other voters of color, mobilizes
and prioritizes issues relevant to their communities."
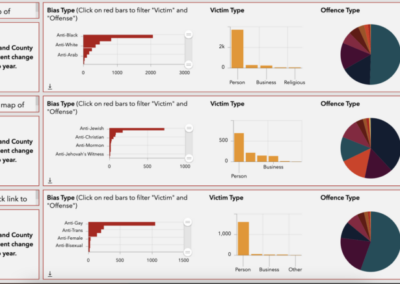
The incident of racist graffiti at Hamilton Elementary School in Anza, Riverside County, and the subsequent arrest of two individuals highlight the enduring issue of hate crimes in California, dispelling the notion of the state's liberal reputation, while emphasizing the importance of
understanding and addressing these acts of hatred through an in-depth examination of hate crime prosecutions and convictions.
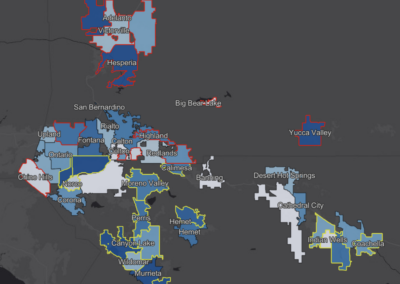
The movement to defund the police gained momentum following the killing of George Floyd in 2020, prompting a reevaluation of the exorbitant amount of funding allocated to policing in the United States. Despite a decrease in criminal activity, police budgets have consistently grown over the years, with local, state, and federal governments contributing to the substantial fiscal support. The allocation of funds to law enforcement, often without clear objectives or constraints, has overshadowed investments in vital community needs such as education,
housing, and mental health services. It is imperative to shift resources towards alternative initiatives that promote safety and security without relying on a system characterized by
violence and discrimination.
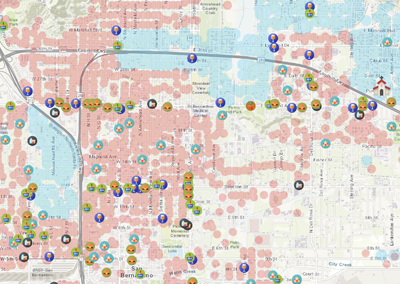
So-called food deserts exist throughout San Bernardino County
and are characterized not only by the lack of affordable grocery
stores within a 1 mile radius, but they are also marked by other
socioeconomic factors such as poverty, racist infrastructure,
unaffordable housing, lack of transportation access and low-income.

This dashboard that looked at the impact of COVID-19
on Black Bodies in communities around the state.