The Black Equity Fund
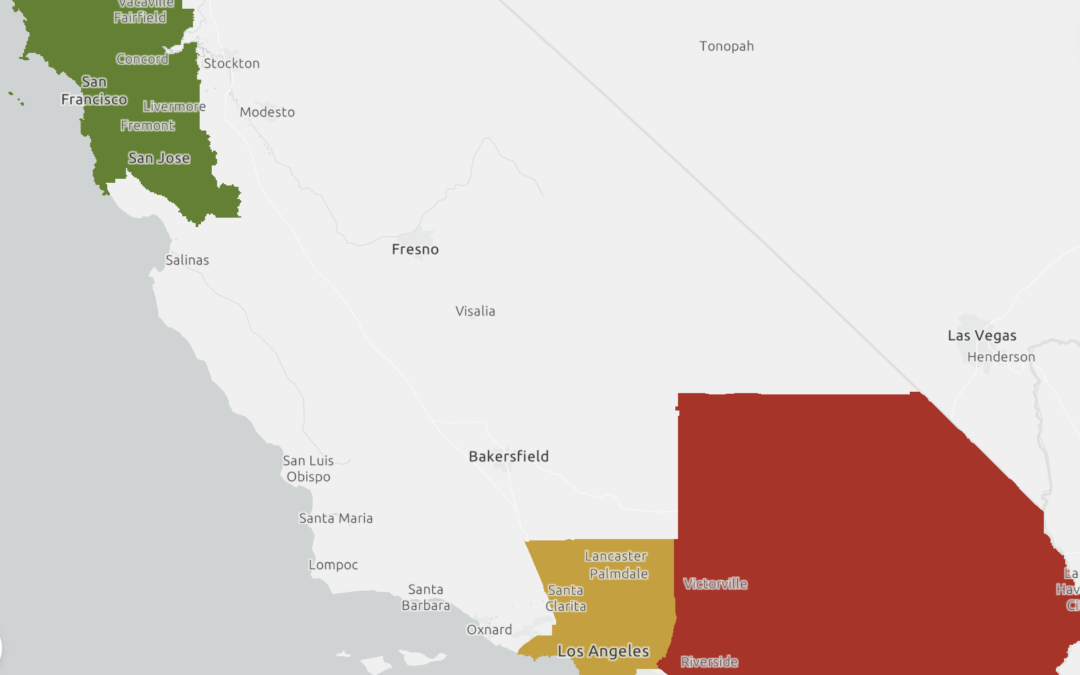
This map and StoryMap combines data visualization and narrative storytelling humanizing the impactful work of the Black Equity Fund in the Inland Empire.

This map and StoryMap combines data visualization and narrative storytelling humanizing the impactful work of the Black Equity Fund in the Inland Empire.

Maps on disinvested communities, equity inclusiveness, COVID recovery, and sustainability/environmental justice grounded the region’s planning process in data helping to ensure equitable decison making.

This study analyzes the variability of police spending in 476 California cities from 2014 to 2019, visually representing the percentage of municipal budgets allocated to police departments and contracts with county sheriff departments. The research highlights significant differences in police spending across the state and investigates the relationships between spending
percentages and population changes during the 5-year period.

Join our mailing list to receive the latest news and updates from our team.

Be among the first to know what MBC has going on. Subscribe to our newsletter to stay in the loop.
Recent Comments